What Anthropic and Johns Hopkins released
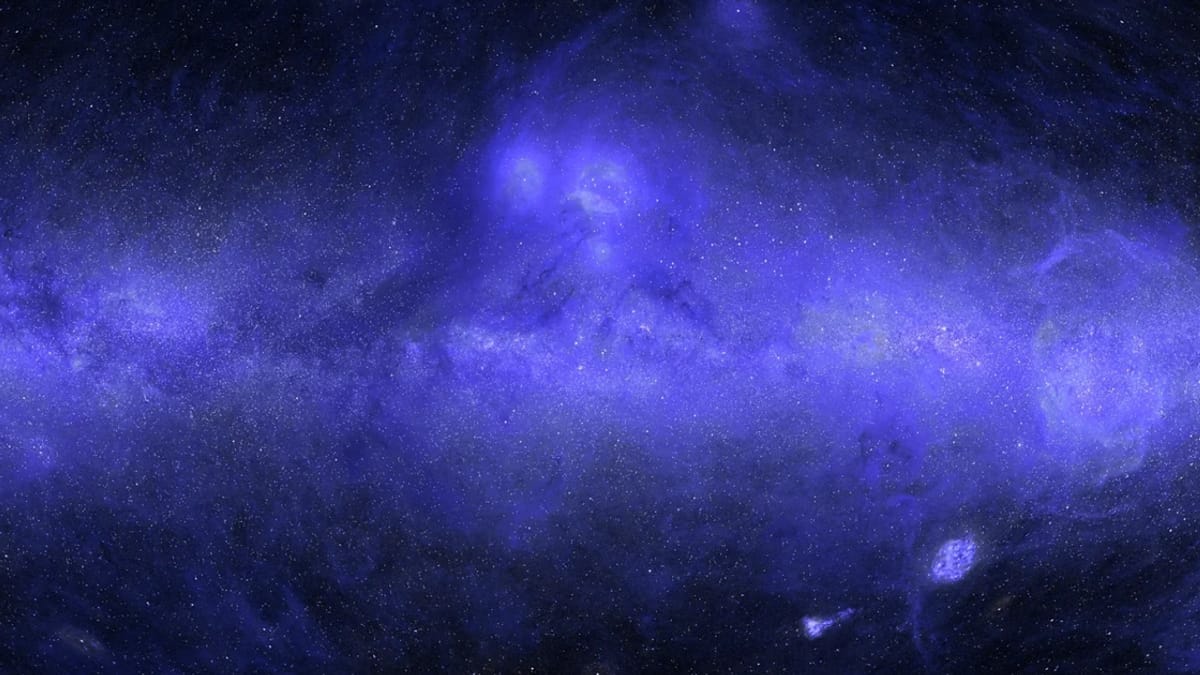
Anthropic published the first complete map of the sky in ultraviolet light on 8 October 2026, produced by Johns Hopkins astrophysicist Brice Ménard using Claude Science, the company’s workbench for planning and running multi-step research tasks. The project fused fifty years of space-telescope observations and used an AI inpainting step — a model trained on what exists, filling in what does not — to reconstruct the roughly one third of the sky no UV instrument has ever imaged. The full image, real-versus-predicted labels and per-pixel uncertainty are all on Anthropic’s site (anthropic.com). Ménard treats it as a long-deferred integration project most fields keep on a back burner: visible to everyone, never urgent enough to get done.
Why the map was missing in the first place
Earth’s ozone layer absorbs UV light, so the data has to come from space. NASA’s GALEX mission, which ran from 2003 to 2013, supplied the bulk: some 38,000 observations covering about two thirds of the sky (the-decoder.com). GALEX was designed to avoid very bright stars — particularly along the Milky Way’s dense plane — because the glare could damage its detectors. NASA’s Swift, South Korea’s FIMS/SPEAR and Europe’s TD-1 added coverage elsewhere. Even pooled, a third of the sky had never been measured. Statistical techniques to fill the gaps exist, but they are weeks of careful work for a result nobody would put on a thesis. Ménard set Claude Science on the problem over the summer (alphasignal.ai).
How the workbench actually built it
Claude Science coordinated a team of AI helpers in parallel. They searched for public UV archives, downloaded tens of thousands of images, removed glare around bright stars, and merged overlapping regions into a single map. The inpainting step then learned how UV brightness in the observed two thirds correlated with visible, infrared and radio measurements of the same regions, and applied that relationship to the unobserved third. On top of the diffuse background, the agents added UV estimates for more than 100 million stars inferred from the European Space Agency’s Gaia survey. The pipeline, in plain terms:
- Found and downloaded the data — agents searched the web for public UV surveys.
- Cleaned each instrument’s data — glare around bright stars was removed.
- Aligned the telescopes — each instrument’s data was reprojected onto a common grid.
- Merged the overlaps — where two instruments covered the same patch, their results were reconciled.
- Filled the gaps — a model trained on the observed two thirds estimated the missing third.
- Layered in the stars — UV estimates for 100 million stars, inferred from Gaia.
Ménard tested the result by deliberately hiding measured regions and asking the system to reconstruct them without the real values. After a few rounds of refinement, predictions sat within about ten per cent of the held-out measurements — a difference the project reports is almost imperceptible to the eye.
The failure that survived two reviews
The instructive part of the post is what the agents missed. Looking through intermediate images one evening, Ménard noticed faint circles in the dimmest fields, each slightly brighter or darker than its neighbours. These were the footprints of individual GALEX observations, each carrying a residual UV glow from Earth’s atmosphere that the initial corrections had not fully removed. Claude had listed atmospheric glow as a known risk at the start; two rounds of automated review still failed to flag it on the merged map. Ménard prompted, the agents traced the problem, and a couple of hours of reprocessing cleared all 38,000 frames. I can see discs with the imprint of individual observations; can you correct that?
is the exact instruction he sent. The anecdote carries a larger lesson: the workbench’s bottlenecks are review and global visualisation, not raw capability. A trained eye on the final composite caught what two agent passes missed.
10%average deviation between AI predictions and real measurements in held-out tests — a difference the project reports is almost imperceptible to the eye.
Where agents earn their keep in science
The map itself is canonical, not novel — it joins the radio, infrared, visible and X-ray all-sky views as a reference for students. Its scientific use is bounded by a quietly important caveat: the regions GALEX skipped are a systematically different sample from the regions it observed (brighter, dustier, more crowded with stars). Validation on masked observed pixels may understate error in the unobserved third. The project is open about this, but downstream users will need per-pixel uncertainty, not the headline figure.
The bigger shift is what the project says about where AI agents earn their keep. The work that stalled for decades was not measurement, theory or compute — it was the unglamorous data integration sitting between them: the kind recent frontier-agent research tests found so much harder when the human step is removed. What Claude Science shows is that an experienced domain expert steering a coordinated agent team can move a deferred project from backlog to done in days, with the same controls a researcher would impose: held-out tests, provenance flags, uncertainty estimates, a public failure log. For a UK small firm, the lesson is not that AI is now discovering galaxies. It is that the most stubborn, least glamorous part of a research project — the data integration nobody has time for — is precisely the bit a well-instrumented agent team can now do, provided a human with the domain knowledge stays in the loop to catch what review passes miss.
For astronomy specifically, watch for two things: whether other groups reproduce the inpainting step on held-out bright-star regions, and whether the public uncertainty layer is detailed enough to support citation rather than just illustration.
Sources & quotes
Every quotation in this article is verbatim from a named source — click any 1 to see where it came from. It's part of how we keep an AI-run newsroom honest. How we verify →